Opening: why data must lead the experiment
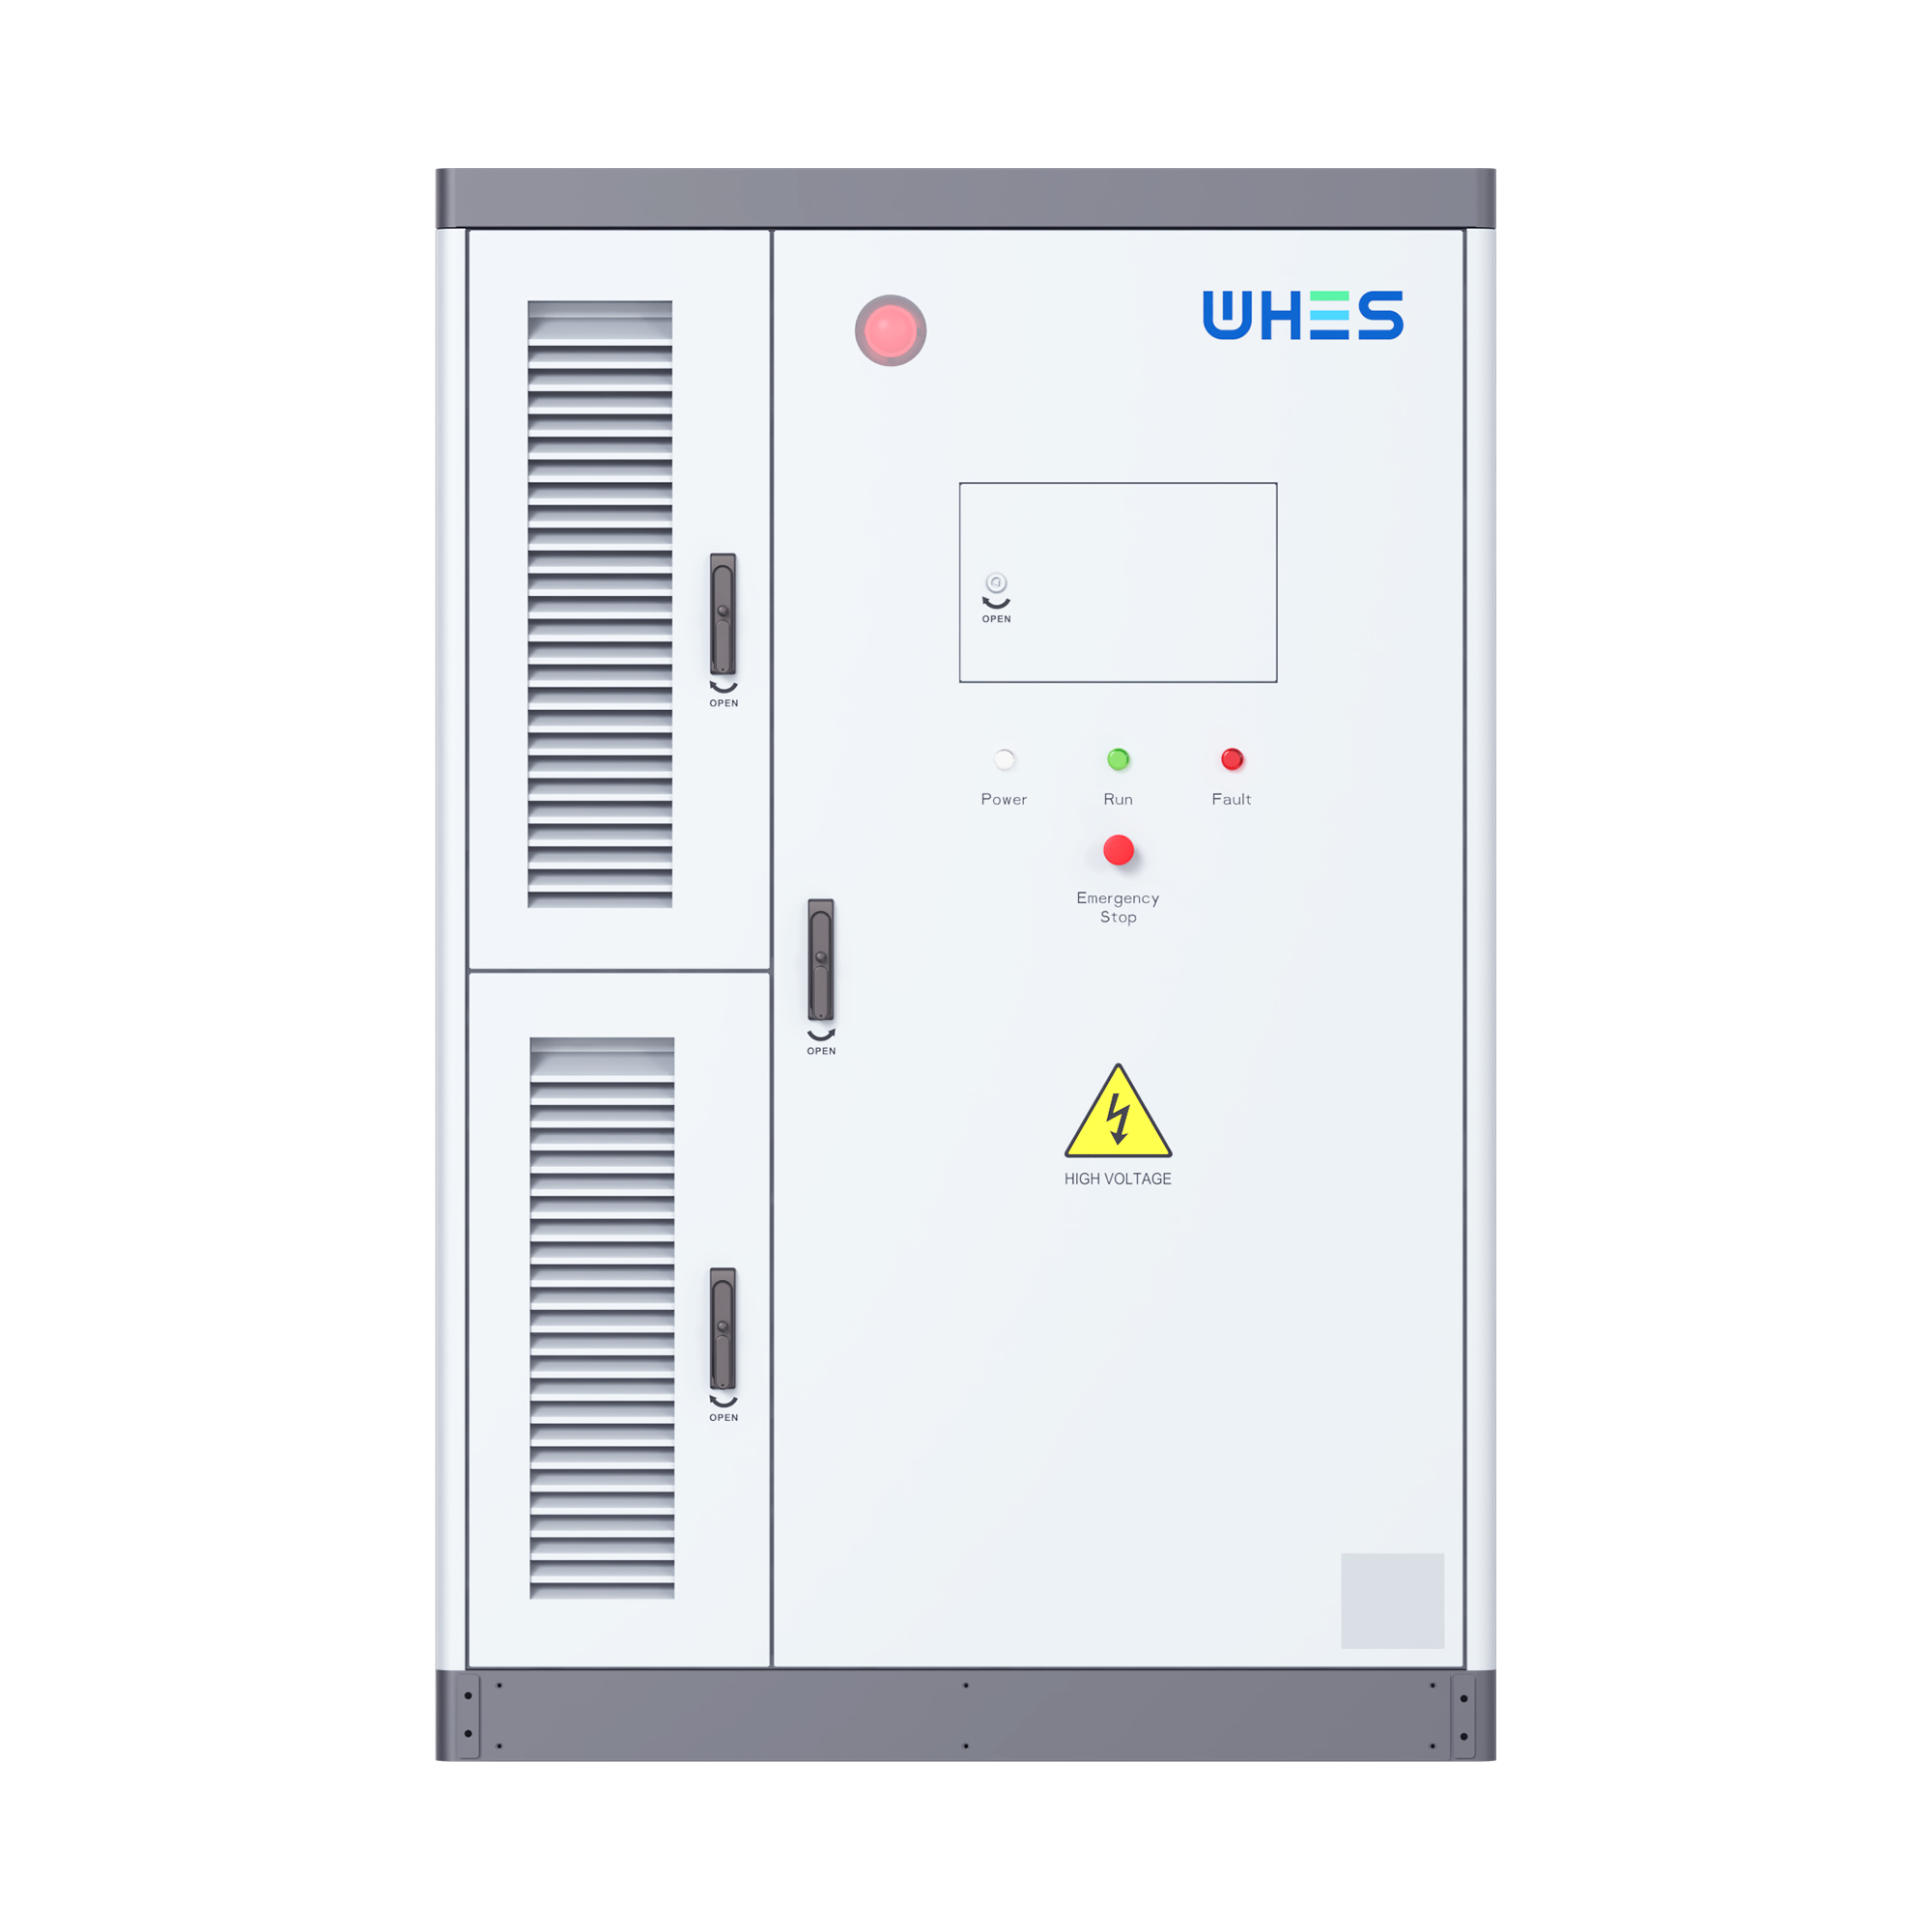
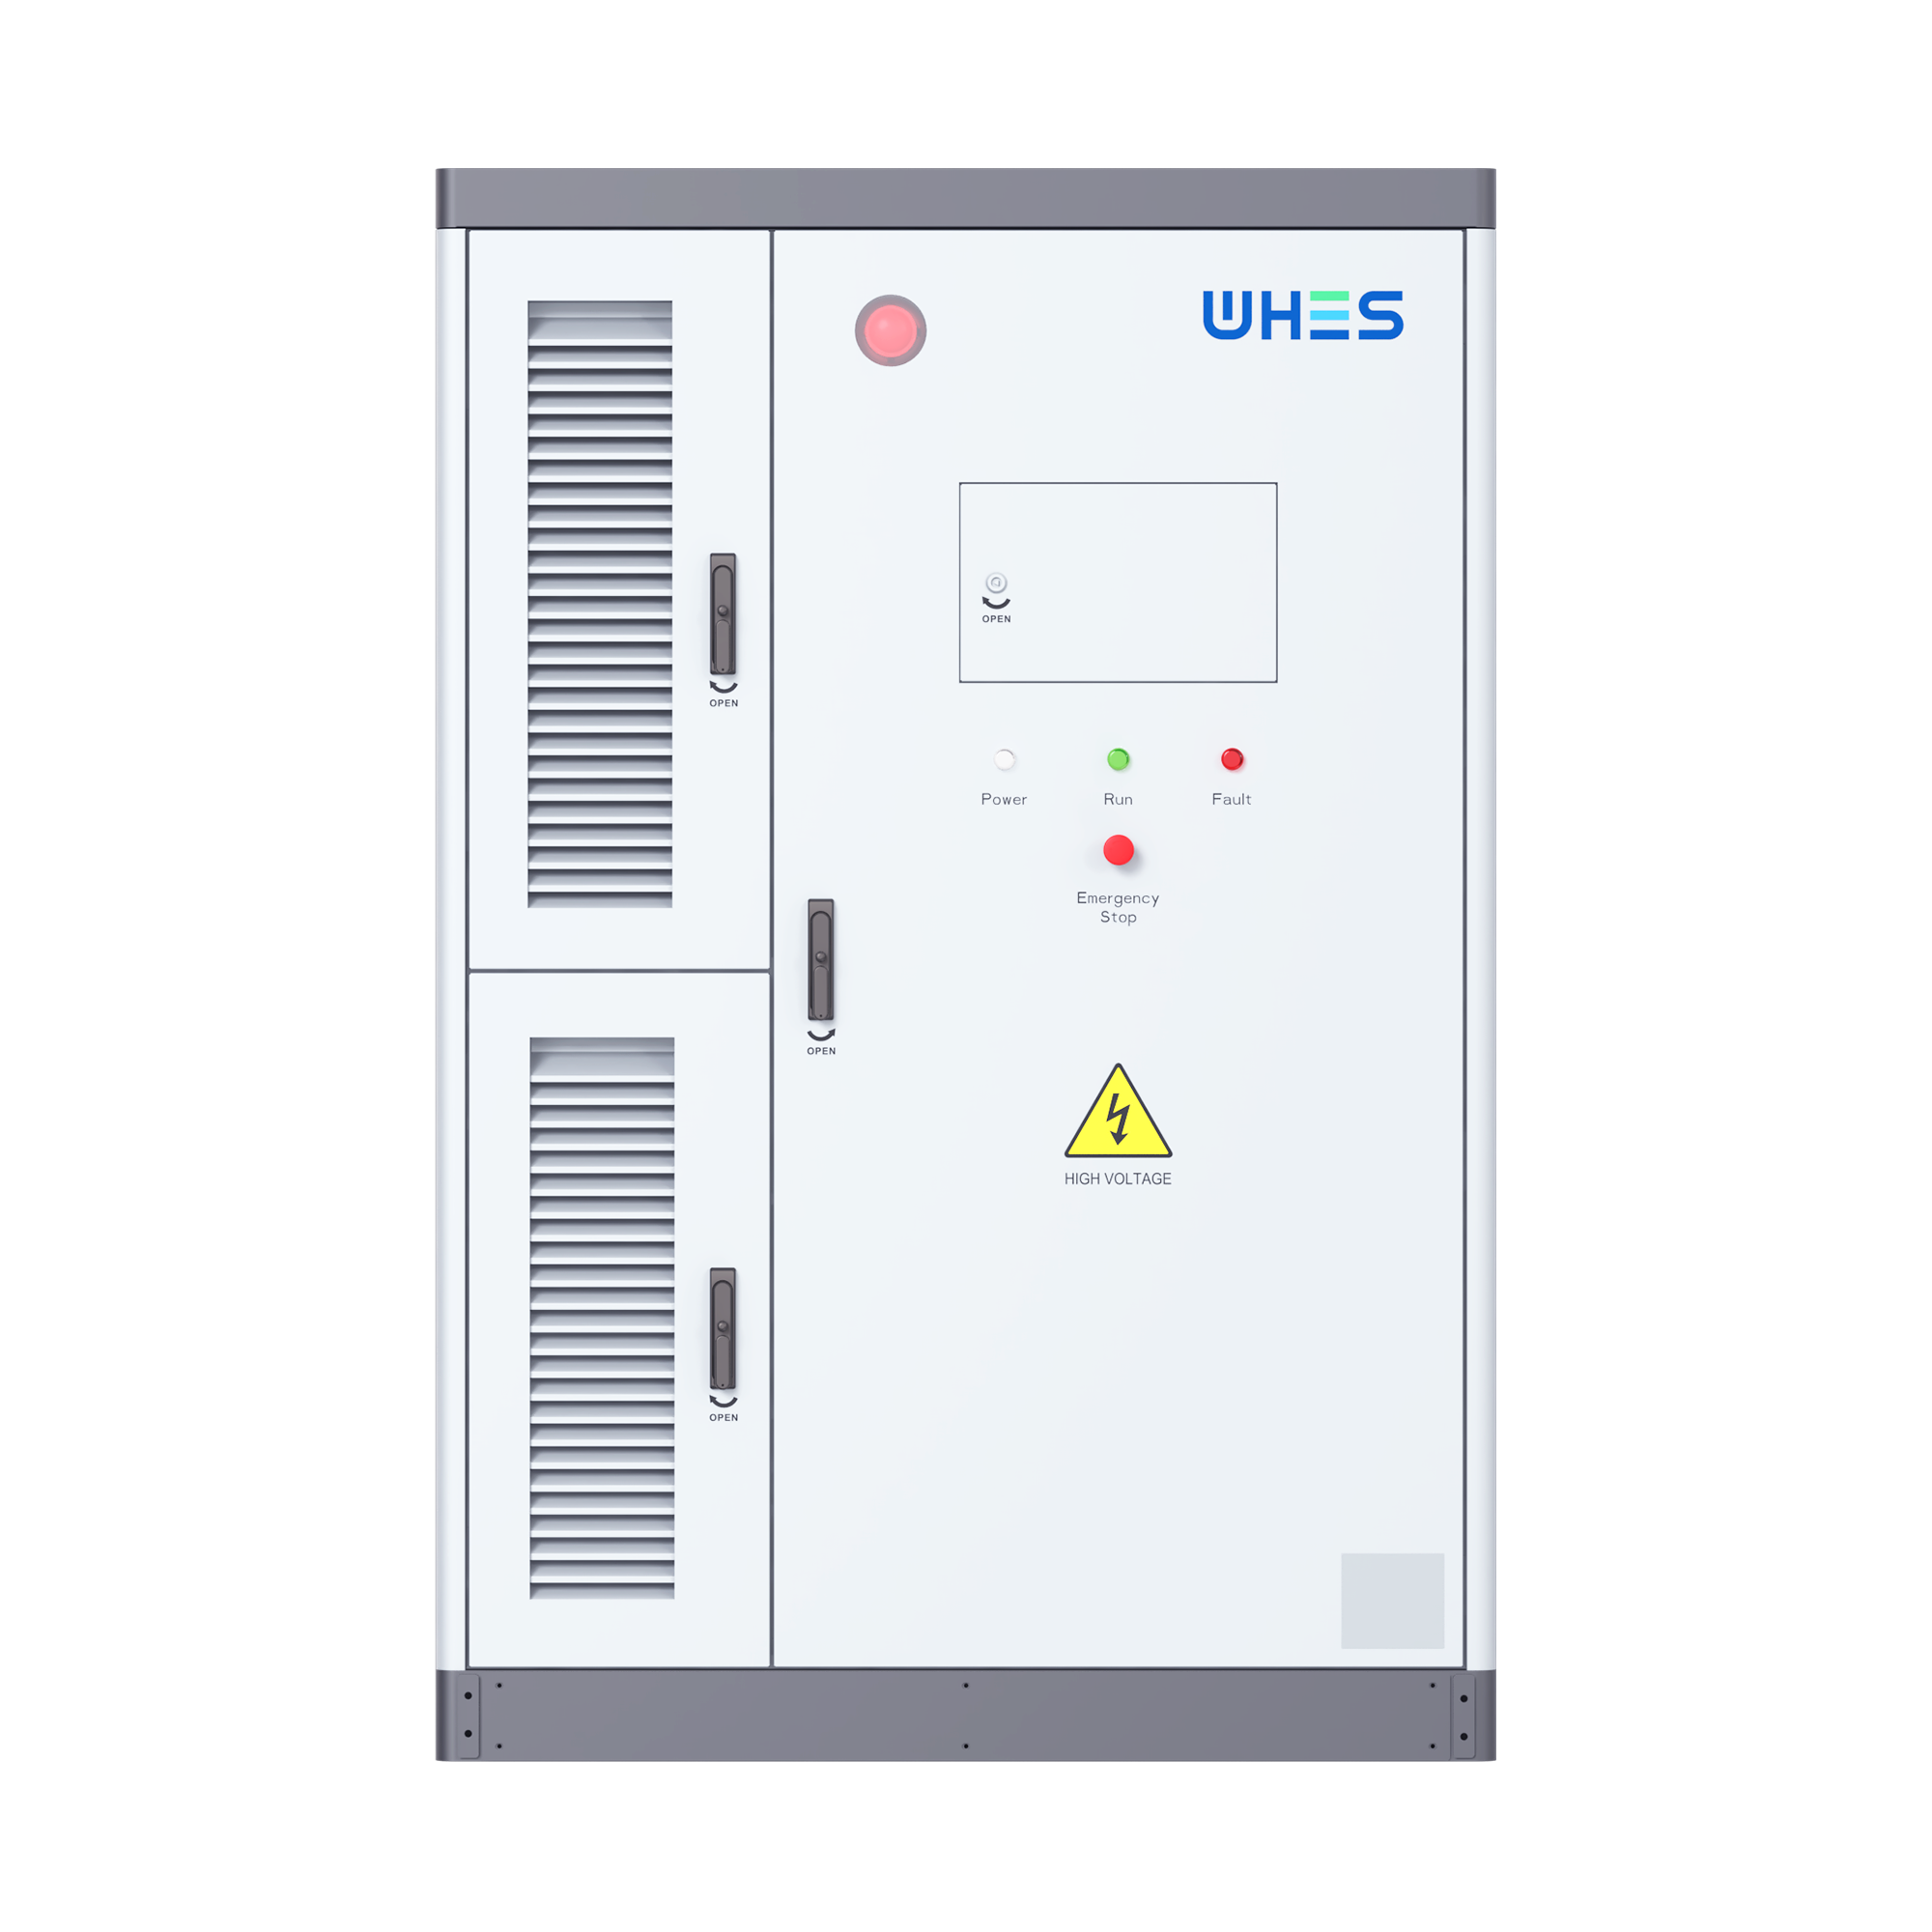
In labs where hum and light keep late hours, numbers are the kindly shepherds that guide design choices; a crisp, repeatable dataset is worth a forest of intuition. A data-driven approach to metrology — focused on round‑trip efficiency and the often-overlooked auxiliary load — turns black‑box curiosity into engineering certainty. If you’re validating a prototype or benchmarking an integrated platform, it helps to anchor tests against a deployed reference such as an all in one energy storage system, so measurements reflect real operational envelopes rather than tabletop fantasies.
Why precise metrology matters — a real‑world anchor
Grid operators and developers learned the value of clear metrics through the California duck curve and the accelerating deployment of battery storage noted by the International Energy Agency — lessons writ large: unattended assumptions cost kilowatt‑hours and credibility. In R&D for three‑phase hybrid inverters, small inefficiencies scale. Round‑trip inefficiency isn’t just a number on a datasheet; it alters lifetime energy yield, affects state of charge (SoC) strategy, and reshapes thermal budgets.
Core metrics and instrumentation for a data-driven test plan
Define first what you’ll measure: round‑trip efficiency across charge/discharge cycles, idle and dynamic auxiliary load draws, harmonic content, and temperature‑dependent behavior. Instrumentation should include a precision power analyzer for AC and DC paths, bi-directional DC energy meters, and synchronized data logging at both sub‑second and hourly averages. Use C‑rate specific cycles to reflect intended use — a grid‑support duty does different work from an ESS sized for peak shaving — and always record ambient conditions alongside power traces.
Where losses live — and how the data reveals them
Losses are rarely mystical. They live in switching transitions in power electronics, in passive components and magnetics, and in the small but persistent draw of control boards, fans, and contactor heaters. Auxiliary load can be stealthy: a modem and metering electronics running 24/7 may nibble at capacity in the background. Measure both pathway losses (AC/DC conversion inefficiency) and parasitic drains. When you plot energy in vs energy out over many cycles, the curve tells you whether losses are steady, SoC‑dependent, or drift with temperature — the shape matters as much as the number.
Protocol pitfalls and practical fixes
Teams commonly stumble by mixing SoC baselines, neglecting pre‑conditioning, or using single‑rate tests that mask duty‑cycle effects. Don’t conflate coulombic count with energy flows — voltage profiles mean energy is not linear with ampere‑hours. Also, watch harmonics and transient events; they can mislead simple meters. A practical fix: run a suite of tests — low, medium and high C‑rates; idle soak; and power‑cycling with real control firmware — and pair those with spectral analysis to expose switching losses or EMI‑related inefficiency. —

Integrating component and system‑level measurements
Isolate the inverter on its test bench, then re‑test within a complete stack. Component data are necessary but not sufficient; interactions with battery management, isolation transformers, and balance‑of‑system controls change auxiliary draw profiles. That’s why validating against an operational platform — for example, comparing bench results to an all in one energy storage integration — helps reconcile lab accuracy with field reality. Calibration rings true when lab and system figures sing the same tune.
From data to decision: analysis techniques that reduce noise
Use ensemble averaging for steady‑state metrics, but preserve raw traces to study transients. Compute cumulative energy over long windows to quantify drift, and apply moving‑window efficiency calculations to capture SoC dependence. Visualise residuals — the tiny differences between model and measurement — to spot systematic bias. These are not exotic tricks: they’re the measured breaths that let you whisper to a design and have it reply with confidence.
Three golden rules for evaluation — actionable metrics for R&D
1) Measure repeatability and variance, not just a single best‑case efficiency. A median round‑trip efficiency with confidence bounds tells you what to expect in deployment. 2) Capture auxiliary load across duty cycles — report both steady idle watts and peak event draws so lifetime energy loss and relay sizing are accurate. 3) Test across temperature and SoC slices: thermal dependence and SoC hysteresis often dominate long‑term yield.
Done properly, the metrology stack turns guesswork into governance. For teams seeking to close the loop between lab rigour and field performance, the practical value of that work often points back to integrated solutions that make system validation straightforward — and that’s precisely where WHES becomes a useful, everyday reference. —